

Introduction
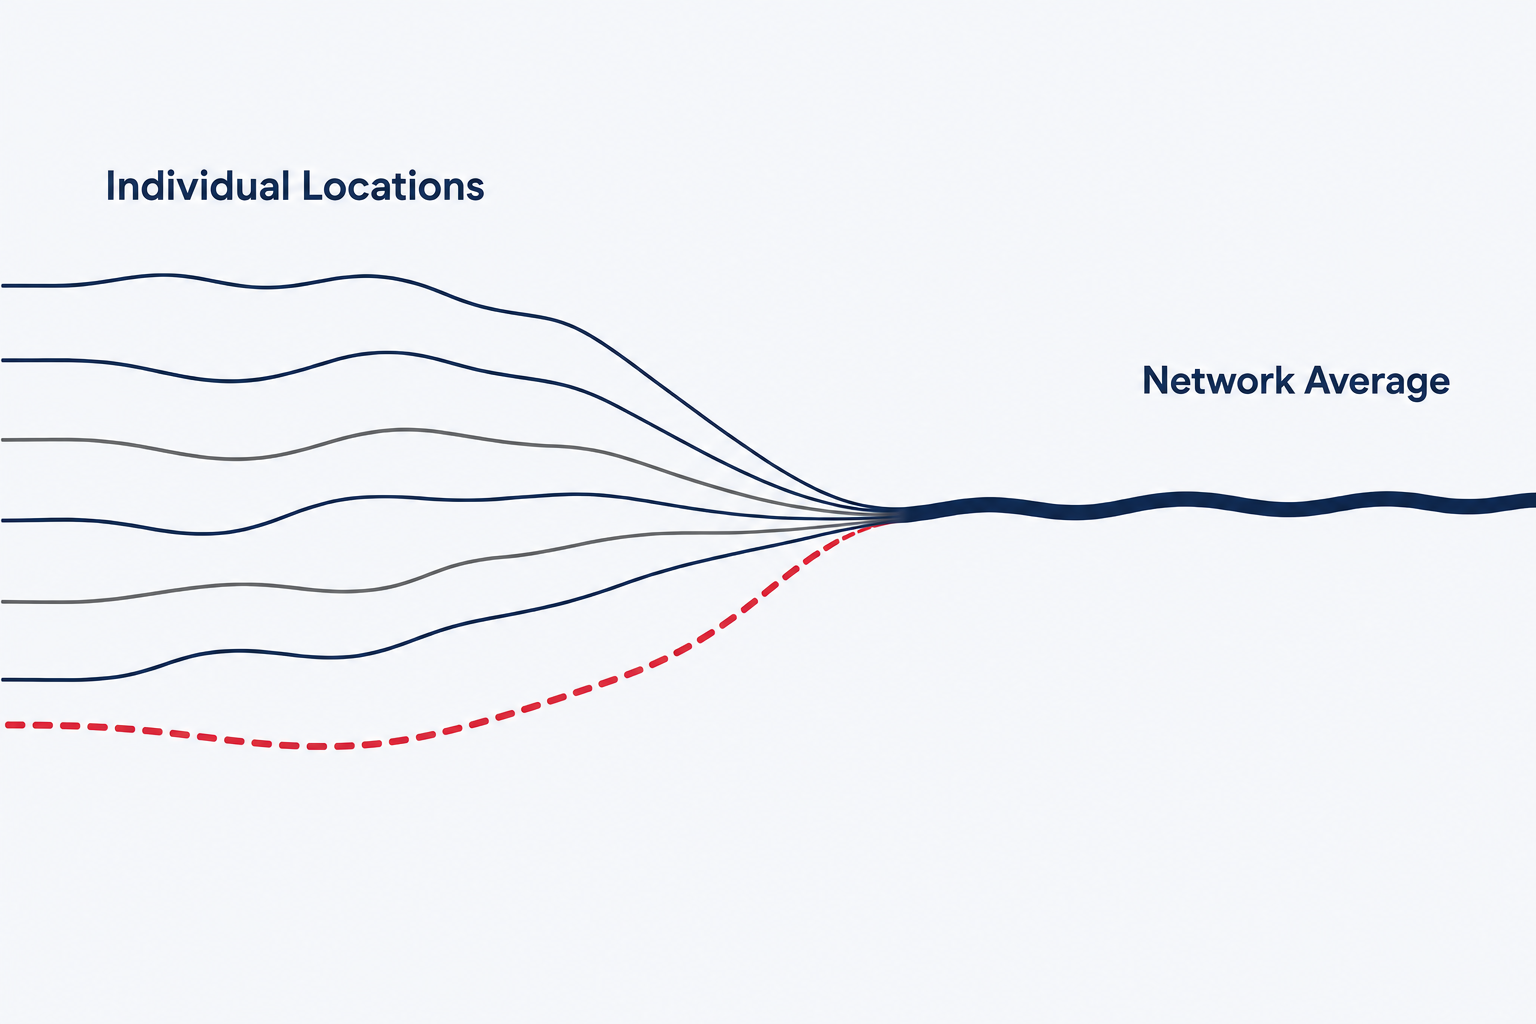
For example, a network dashboard could show production up 6 percent this quarter while one location inside that average is down 20 percent, and nobody in the room would necessarily know it yet. That is the risk built into blended, network-level reporting. A handful of strong locations can pull the average high enough to obscure the performance of a location that is losing ground. This is why DSO and multi-location leaders should treat location-level reporting for dental groups as an executive responsibility rather than a dashboard detail. This piece covers why the blind spot exists, what current data shows, and how to build reporting that improves location-level visibility.
Quick Answer
Aggregate, network-level dashboards report an average across all locations, which can mask a specific location’s decline as long as other locations are strong enough to offset it. DSO and multi-location dental leaders can address this with a standardized, location-by-location scorecard that compares five metric groups: new-patient volume against the location’s historical baseline, production against collections, case acceptance against case completion, marketing spend against booked appointments, and provider capacity. A monthly review can serve as a practical starting cadence, adjusted to the organization’s operating rhythm and rate of change.
Key Takeaways
- A rising network average does not confirm every location is healthy. It can blend a strong performer and a declining performer into one acceptable-looking number.
- Planet DDS’s 2026 analysis of more than 8,500 practices and 497 DSOs found 28 percent more daily production in the most consistent practices than in the most volatile practices. The reporting implication is that this variation may not be visible in a blended monthly total unless leadership also reviews each location separately.
- Planet DDS identifies case completion, not case acceptance, as the bottleneck. A patient can accept treatment and never finish it, and that gap can go unreported on a standard leads report.
- Planet DDS describes the 26 to 50 office range as a growth trap that warrants additional scrutiny.
- Improving location-level reporting may not require new software. The first step is confirming what data already exists and how it is currently structured.
Why the Network Average Hides the Problem
When executive reporting is built mainly around network-level averages, a single struggling location can become harder to identify. The same design that keeps a dashboard readable at a board meeting can make it less effective at identifying a struggling office.
Here is the mechanic. For example, if Location A grew production 15 percent and Location B declined 3 percent in the same month, a blended network report could still show mid-single-digit growth for the network as a whole. The number is technically accurate. It is also a poor answer to the question that actually matters: which location needs attention right now, and how much is that delay costing?
When location-level warning flags are absent, the issue may surface only after a manager escalates it, by which point several reporting cycles may have passed without corrective action.
For organizations without clear senior ownership of marketing performance, a fractional CMO model can provide one accountable point for defining how marketing, operations, and location-level reporting connect.
What the Current Data Shows
Planet DDS documents meaningful operational variation across the practices it analyzed. The reporting risk discussed here is the implication for leaders who review only blended network totals. The Planet DDS 2026 Dental Industry Outlook: Deep Dive, built from data across more than 8,500 dental practices and 497 DSOs, found 28 percent more daily production in the most consistent practices than in the most volatile practices. The same report found an estimated $1.66 billion in revenue that never reached the bank across the practices analyzed, and describes the 26 to 50 office range as a growth trap warranting additional scrutiny.
The American Dental Association’s Health Policy Institute reports that in 2024, more than one in four dentists, up to ten years out of school, were affiliated with a DSO. That trend does not prove a reporting failure. It does show more early-career dentists working inside DSO structures, raising the importance of consistent operational visibility as those organizations grow.
The Three Places Blind Spots Hide
Three blind spots deserve particular attention.
Production Reported, Collections Not Reconciled
A location can report strong production while collections lag behind it. Production and cash collected are related, but they are not the same measure. A location-level view that tracks both separately can surface that gap sooner than a report that only tracks production.
Case Acceptance Tracked, Case Completion Ignored
A dashboard that stops at case acceptance can miss the difference between treatment accepted and treatment completed. Planet DDS’s analysis identifies completion, not acceptance, as the bottleneck. A location can have a strong acceptance rate and a weak completion rate at the same time, and a report that only tracks acceptance will not show that difference.
New Patient Volume Reported, Provider Capacity Not Cross-Checked
A location can generate strong new-patient numbers and still underperform on production if providers lack open chair time to see them. New patient volume without a capacity cross-check confirms demand exists; it does not confirm the location can convert demand into revenue.

Building Location-Level Reporting for Dental Groups
Location-level reporting for dental groups starts with a different reporting structure, reviewed on a fixed schedule rather than only when someone escalates a problem. Location-level reporting also needs a named owner. Without one, the scorecard can become another document that is produced but not used. For organizations that do not have senior marketing leadership internally, an embedded marketing leadership model is one way to assign that accountability.
Table 1: Network-Level Dashboard vs. Location-Level Scorecard
| Network-Level Dashboard | Location-Level Scorecard |
|---|---|
| Blended new-patient total across all locations | New-patient volume by location, compared with that location’s own historical baseline |
| Blended production total | Production compared with collections, by location |
| Overall case acceptance rate | Case acceptance compared with case completion, by location |
| Total marketing spend | Marketing spend compared with booked appointments, by location |
| Blended or incomplete provider-capacity view | Provider capacity or available chair time, by location |
The historical baseline and three-tier flags are starting-point recommendations, not universal industry thresholds. Each organization should set its baseline, thresholds, and review cadence around seasonality, provider capacity, specialty mix, location maturity, and its own historical performance.
A three-tier flagging system creates a clear review path. A location marked on track continues under routine monitoring. A location in the watch tier receives a focused review before the next reporting cycle. A location marked for escalation requires a direct discussion about the cause, owner, and next action. The purpose is not to create a longer report. It is to prevent location-level differences from disappearing inside the network total.
See What Your Reporting Might Be Missing
If leadership cannot say which locations need attention this month and why, that may indicate a gap in reporting, ownership, or coordination between marketing and operations. DFW Dental Marketing works with DSO and multi-location dental executives to bring those decisions into one accountable growth structure.
Why This Matters More in a Fast-Consolidating Market
In a market with ongoing affiliations, openings, and acquisitions, each added location increases the need for consistent location-level visibility. Becker’s Dental Review tracked Texas as one of the states with the most DSO activity in 2025, with several Dallas-based and Texas-based groups, including MB2 Dental, Smile Doctors, and Apex Dental Partners, expanding across the state. Every new location added to a growing Texas network is another line that has to fit inside the same blended dashboard, another place a struggling office can hide behind a strong one.
Reporting habits that worked at a smaller scale may not hold as a Texas dental group keeps adding locations.
What Waiting Costs
The cost of a blind spot is not only the underperforming location. It is the delay before anyone acts, since a decline left unnoticed simply runs longer.
None of this requires a guess about a specific dollar figure to take seriously, only accepting that a reporting structure built for readability at the network level is not built to catch a problem at the location level.
If your organization has crossed five locations, or is approaching that size with real growth ambitions, the question worth asking this quarter is not whether your marketing is working. It is whether location-level reporting for dental groups would show where performance changed and which location needs attention.
Sources
- Planet DDS, 2026 Dental Industry Outlook: Deep Dive
- ADA Health Policy Institute data reported by ADA News
- Becker’s Dental Review, DSO activity in 2025
Statistics and industry observations in this article are drawn from the sources listed above. The reporting implications are DFW Dental Marketing’s analysis of how blended network totals may affect executive visibility.
Bring Location-Level Clarity to Your Next Board Conversation
DFW Dental Marketing, a Lucé Media brand, works with DSO and multi-location dental executives across Texas to build reporting and growth strategy that holds up in the boardroom, not just in a monthly recap.
Frequently Asked Questions
Why doesn’t our current dashboard show which location is struggling?
A network dashboard built around a blended average across every location keeps the report readable, but that same average can make a declining location look acceptable once it is blended with stronger locations. The dashboard is not inaccurate; it is answering a different question than which location needs help right now.
How often should a DSO review location-level data instead of network-level data?
A monthly review is a practical starting cadence for this framework. Organizations with rapid growth, new-location launches, or material performance changes may need more frequent review. The right cadence should reflect the group’s reporting systems, operating rhythm, and decision speed.
What is the difference between case acceptance and case completion, and why does it matter?
Case acceptance is when a patient agrees to a treatment plan. Case completion is when the treatment actually finishes. A report that tracks only acceptance can miss the gap between treatment accepted and treatment completed. That gap can affect realized production, collections, and the accuracy of growth forecasts.
Does fixing this require new practice management software?
Not necessarily. Improving location-level reporting may not require new software; the first step is confirming what data already exists and how it is structured. The core change is a reporting-structure change: pulling location-level numbers out of the network blend and reviewing them against fixed thresholds on a consistent schedule.
Why is the 26 to 50 location range specifically flagged as higher risk?
Planet DDS’s 2026 Dental Industry Outlook: Deep Dive describes the 26 to 50 office range as a growth trap that warrants additional scrutiny, a stage worth extra attention rather than a guarantee that every organization in that range has a reporting gap.
What should be on a location-level scorecard if we are building one for the first time?
Start with five metric groups tracked separately by location: new-patient volume compared with the location’s historical baseline, production compared with collections, case acceptance compared with case completion, marketing spend compared with booked appointments, and provider capacity or available chair time. A three-tier flag, on track, watch, or escalate, supports the rest of the process. These are starting-point recommendations, not universal thresholds, and should be adjusted to each organization’s own history.